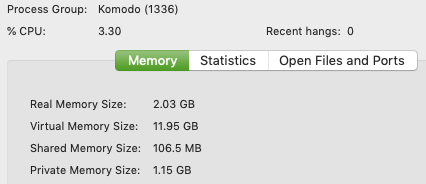
It seems like when I do project wide finds, then open and edit a bunch of files, Komodo Edit gets really slow. It’s using about 1.1GB of memory, and virtual memory size is almost 12GB:

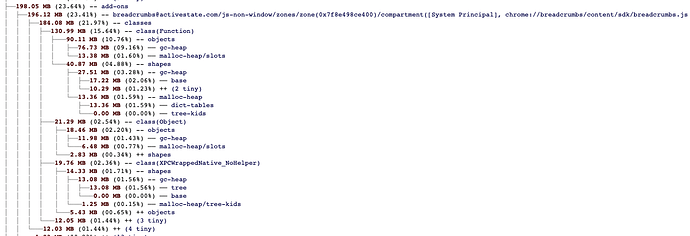
I have captures of the anon-memory-report.json.gz file, but I’m not sure I want to publicly upload that. In it, there are a bunch of lines about breadcrumbs.js . Here’s one using 76MB:
  {
    "process": "Main Process (pid 1336)",
    "path": "explicit/add-ons/breadcrumbs@activestate.com/js-non-window/zones/zone(0x7f8e498ce400)/compartment([System Principal], chrome:\\\\breadcrumbs\\content\\sdk\\breadcrumbs.js (from: resource:\\\\gre\\modules\\commonjs\\toolkit\\loader.js:236))/classes/class(Function)/objects/gc-heap",
    "kind": 0,
    "units": 0,
    "amount": 80460576,
    "description": "Objects, including fixed slots."
  }
Also, I see a bunch of lines on findResultsTab.xul. For example:
{
"process": "Main Process (pid 1336)",
"path": "explicit/window-objects/top(none)/detached/window(chrome:\\\\komodo\\content\\find\\findResultsTab.xul)/style-sheets",
"kind": 1,
"units": 0,
"amount": 1161952,
"description": "Memory used by style sheets within a window."
},
{
"process": "Main Process (pid 1336)",
"path": "explicit/window-objects/top(none)/detached/window(chrome:\\\\komodo\\content\\find\\findResultsTab.xul)/style-sheets",
"kind": 1,
"units": 0,
"amount": 1161952,
"description": "Memory used by style sheets within a window."
},
{
"process": "Main Process (pid 1336)",
"path": "explicit/window-objects/top(none)/detached/window(chrome:\\\\komodo\\content\\find\\findResultsTab.xul)/style-sheets",
"kind": 1,
"units": 0,
"amount": 1161952,
"description": "Memory used by style sheets within a window."
},
{
"process": "Main Process (pid 1336)",
"path": "explicit/window-objects/top(none)/detached/window(chrome:\\\\komodo\\content\\find\\findResultsTab.xul)/style-sheets",
"kind": 1,
"units": 0,
"amount": 1161952,
"description": "Memory used by style sheets within a window."
},
{
"process": "Main Process (pid 1336)",
"path": "explicit/window-objects/top(none)/detached/window(chrome:\\\\komodo\\content\\find\\findResultsTab.xul)/style-sheets",
"kind": 1,
"units": 0,
"amount": 1161952,
"description": "Memory used by style sheets within a window."
},
{
"process": "Main Process (pid 1336)",
"path": "explicit/window-objects/top(none)/detached/window(chrome:\\\\komodo\\content\\find\\findResultsTab.xul)/style-sheets",
"kind": 1,
"units": 0,
"amount": 1161952,
"description": "Memory used by style sheets within a window."
},
{
"process": "Main Process (pid 1336)",
"path": "explicit/window-objects/top(none)/detached/window(chrome:\\\\komodo\\content\\find\\findResultsTab.xul)/style-sheets",
"kind": 1,
"units": 0,
"amount": 1161952,
"description": "Memory used by style sheets within a window."
},
{
"process": "Main Process (pid 1336)",
"path": "explicit/window-objects/top(none)/detached/window(chrome:\\\\komodo\\content\\find\\findResultsTab.xul)/style-sheets",
"kind": 1,
"units": 0,
"amount": 1161952,
"description": "Memory used by style sheets within a window."
},
{
"process": "Main Process (pid 1336)",
"path": "explicit/window-objects/top(none)/detached/window(chrome:\\\\komodo\\content\\find\\findResultsTab.xul)/style-sheets",
"kind": 1,
"units": 0,
"amount": 1161952,
"description": "Memory used by style sheets within a window."
},
{
"process": "Main Process (pid 1336)",
"path": "explicit/window-objects/top(chrome:\\\\komodo\\content\\komodo.xul, id=3)/active/window(chrome:\\\\komodo\\content\\find\\findResultsTab.xul)/style-sheets",
"kind": 1,
"units": 0,
"amount": 1161968,
"description": "Memory used by style sheets within a window."
},
Note that this is sorted by size:
jq '.reports' < memory-report.json | jq 'sort_by(.amount)'
@careyh, my main question is whether the amount of memory being used seems excessive and if it’s something I should try to investigate. If so, I have a few more questions:
- Is the
amountlisted in each row just for that component or is it cumulative? I wonder because the bottom of the list shows this:
{
    "process": "Main Process (pid 1336)",
    "path": "page-faults-soft",
    "kind": 2,
    "units": 2,
    "amount": 28490173,
    "description": "The number of soft page faults (also known as 'minor page faults') that have occurred since the process started.  A soft page fault occurs when the process tries to access a page which is present in physical memory but is not mapped into the process's address space.  For instance, a process might observe soft page faults when it loads a shared library which is already present in physical memory. A process may experience many thousands of soft page faults even when the machine has plenty of available physical memory, and because the OS services a soft page fault without accessing the disk, they impact performance much less than hard page faults."
  },
  {
    "process": "Main Process (pid 1336)",
    "path": "js-main-runtime/compartments/classes/objects/malloc-heap/slots",
    "kind": 1,
    "units": 0,
    "amount": 29643712,
    "description": "Non-fixed object slots."
  },
  {
    "process": "Main Process (pid 1336)",
    "path": "explicit/window-objects/top(chrome:\\\\komodo\\content\\komodo.xul, id=3)/active/window(chrome:\\\\komodo\\content\\komodo.xul)/js-compartment([System Principal], about:blank)/cross-compartment-wrapper-table",
    "kind": 1,
    "units": 0,
    "amount": 33554432,
    "description": "The cross-compartment wrapper table."
  },
  {
    "process": "Main Process (pid 1336)",
    "path": "js-main-runtime/compartments/cross-compartment-wrapper-table",
    "kind": 1,
    "units": 0,
    "amount": 40899456,
    "description": "The cross-compartment wrapper table."
  },
  {
    "process": "Main Process (pid 1336)",
    "path": "window-objects/style-sheets",
    "kind": 2,
    "units": 0,
    "amount": 57241824,
    "description": "This is the sum of all windows' 'style-sheets' numbers."
  },
  {
    "process": "Main Process (pid 1336)",
    "path": "explicit/xpconnect/runtime",
    "kind": 1,
    "units": 0,
    "amount": 67401584,
    "description": "The XPConnect runtime."
  },
  {
    "process": "Main Process (pid 1336)",
    "path": "explicit/add-ons/breadcrumbs@activestate.com/js-non-window/zones/zone(0x7f8e498ce400)/compartment([System Principal], chrome:\\\\breadcrumbs\\content\\sdk\\breadcrumbs.js (from: resource:\\\\gre\\modules\\commonjs\\toolkit\\loader.js:236))/classes/class(Function)/objects/gc-heap",
    "kind": 0,
    "units": 0,
    "amount": 80460576,
    "description": "Objects, including fixed slots."
  },
  {
    "process": "Main Process (pid 1336)",
    "path": "js-main-runtime/compartments/classes/objects/gc-heap",
    "kind": 0,
    "units": 0,
    "amount": 166260336,
    "description": "Objects, including fixed slots."
  },
  {
    "process": "Main Process (pid 1336)",
    "path": "js-main-runtime-gc-heap-committed/used/gc-things",
    "kind": 2,
    "units": 0,
    "amount": 245087464,
    "description": "GC things: objects, strings, scripts, etc."
  },
  {
    "process": "Main Process (pid 1336)",
    "path": "explicit/window-objects/top(chrome:\\\\komodo\\content\\komodo.xul, id=3)/active/window(chrome:\\\\komodo\\content\\komodo.xul)/dom/orphan-nodes",
    "kind": 1,
    "units": 0,
    "amount": 252631744,
    "description": "Orphan DOM nodes, i.e. those that are only reachable from JavaScript objects."
  },
  {
    "process": "Main Process (pid 1336)",
    "path": "window-objects/dom/orphan-nodes",
    "kind": 1,
    "units": 0,
    "amount": 252701920,
    "description": "Orphan DOM nodes, i.e. those that are only reachable from JavaScript objects."
  },
  {
    "process": "Main Process (pid 1336)",
    "path": "resident",
    "kind": 2,
    "units": 0,
    "amount": 2154266624,
    "description": "Memory mapped by the process that is present in physical memory, also known as the resident set size (RSS).  This is the best single figure to use when considering the memory resources used by the process, but it depends both on other processes being run and details of the OS kernel and so is best used for comparing the memory usage of a single process at different points in time."
  },
  {
    "process": "Main Process (pid 1336)",
    "path": "vsize",
    "kind": 2,
    "units": 0,
    "amount": 12887932928,
    "description": "Memory mapped by the process, including code and data segments, the heap, thread stacks, memory explicitly mapped by the process via mmap and similar operations, and memory shared with other processes. This is the vsize figure as reported by 'top' and 'ps'.  This figure is of limited use on Mac, where processes share huge amounts of memory with one another.  But even on other operating systems, 'resident' is a much better measure of the memory resources used by the process."
  }
That adds up to well over 12GB, so I’m thinking it’s combining some stuff. I’m wondering if that means the breadcrumbs and find results XUL lines aren’t really problems.
-
Do you have any idea how many breadcrumb lines should show per open file? How about
findResultsTab.xullines per search. I’m wondering if there’s a memory leak once files are closed. -
I see https://github.com/Komodo/KomodoEdit/commit/ad03354b98167a7a8785acbe8c6cb3c777f29015 which is supposed to fix a memory leak in breadcrumbs. I see many more
addEventListenercalls thanremoveEventListener. Should there be the same number? If an event listener is not removed, will it be stuck in memory once the tab is closed? -
Do you have any tips on tracking down memory leaks?


