This is still not fixed from K10.
And it’s steady too.
CALL COUNT
madvise 1
ulock_wait 1
ulock_wake 1
getrusage 2
bsdthread_ctl 4
psynch_cvbroad 4
poll 6
wait4 6
kevent_qos 12
workq_kernreturn 39
select 63
psynch_cvsignal 153
psynch_cvwait 249
gettimeofday 495
psynch_mutexdrop 8237
psynch_mutexwait 8401
DTrace log: https://gist.github.com/jhihn/adf70028a4a3c84c3ec5ac981ff10e5e
I’m working on a better dtrace but I have to wait until I reboot for that.
Could you try disabling Git?
Git has been disabled. I’m still seeing it.
To test this, just leave K11 open over the weekend. Let the laptop do it’s thing, try using K11 on Monday. I can’t really explain why, but it’ll go from behaving properly as I leave for the weekend, to being abysmal. Scrolling, saving, editing (even just cursor movement) lags by seconds. Same window, same process, same files open, just 48 hours later. I know it sounds silly that if I’m not doing anything, it’s not doing anything, but I think it’s doing something. I am beginning to suspect it’s not in Komodo per se, and instead it’s a lower level platform issue. It’s as if something is allocating and maybe even freeing, but there’s some list that is growing behind the scenes.
Would it be possible to have some script run in K11 that performs an operation or set of operations periodically and records the time performed and amount of time taken so we can see if this is increasing over time? If it appears suddenly, then it’s a API issue, if it increases exponentially it’s a linked list issue and if it increases between those two, then it’s got a few possibilities. We’ll also be able to get numbers on how long it takes this to show up.
Could you take a JS and Python profile log when Komodo is being slow?
http://docs.komodoide.com/SDK/How_to_profile_Komodo
Don’t make it too long, no more than 10 seconds or so.
My trial ran out and I can no longer run K11.
I tried to gather reports using the link you provided but each time I got errors.
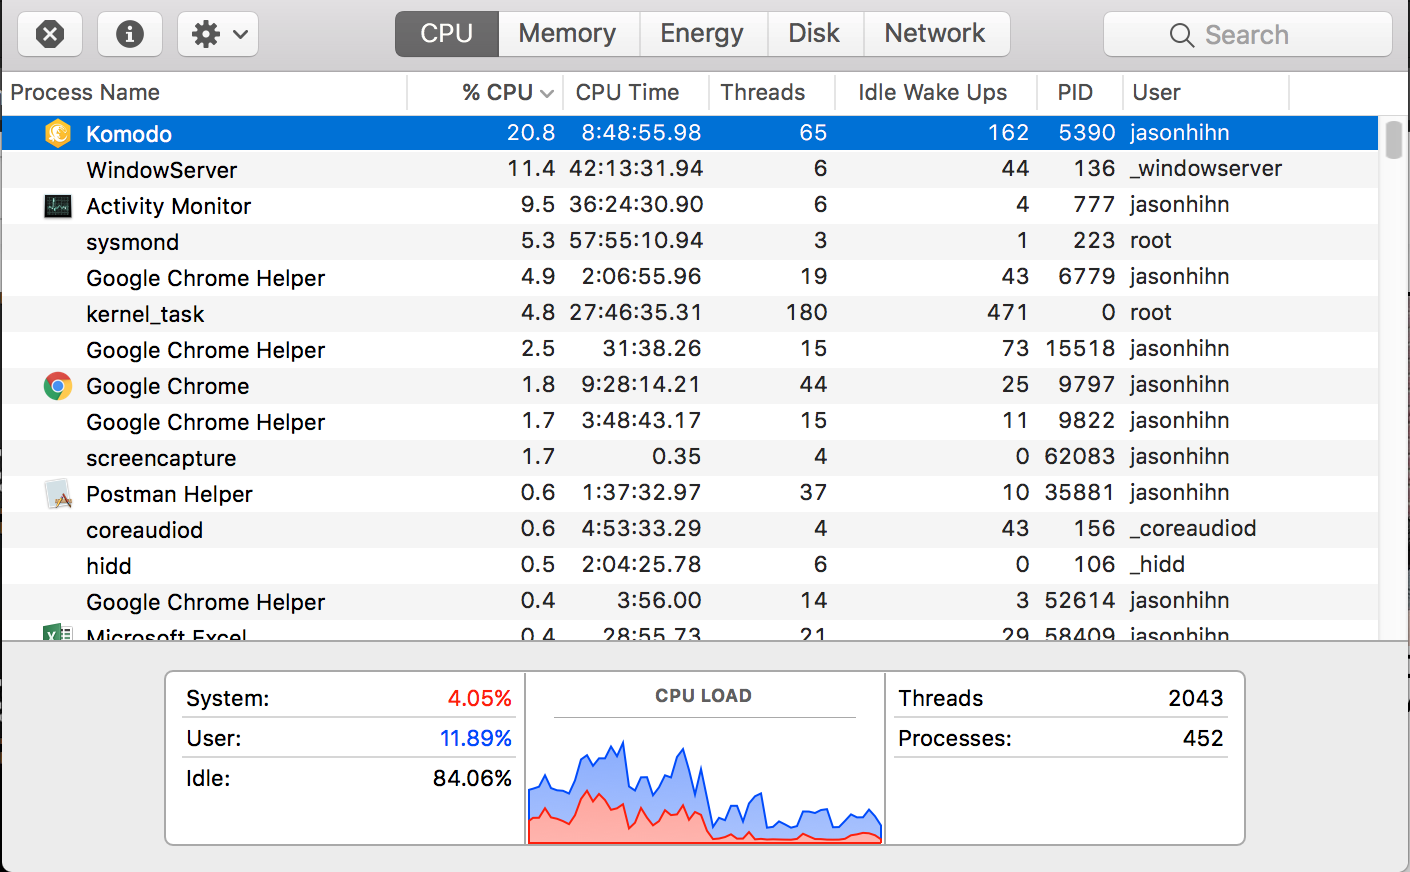
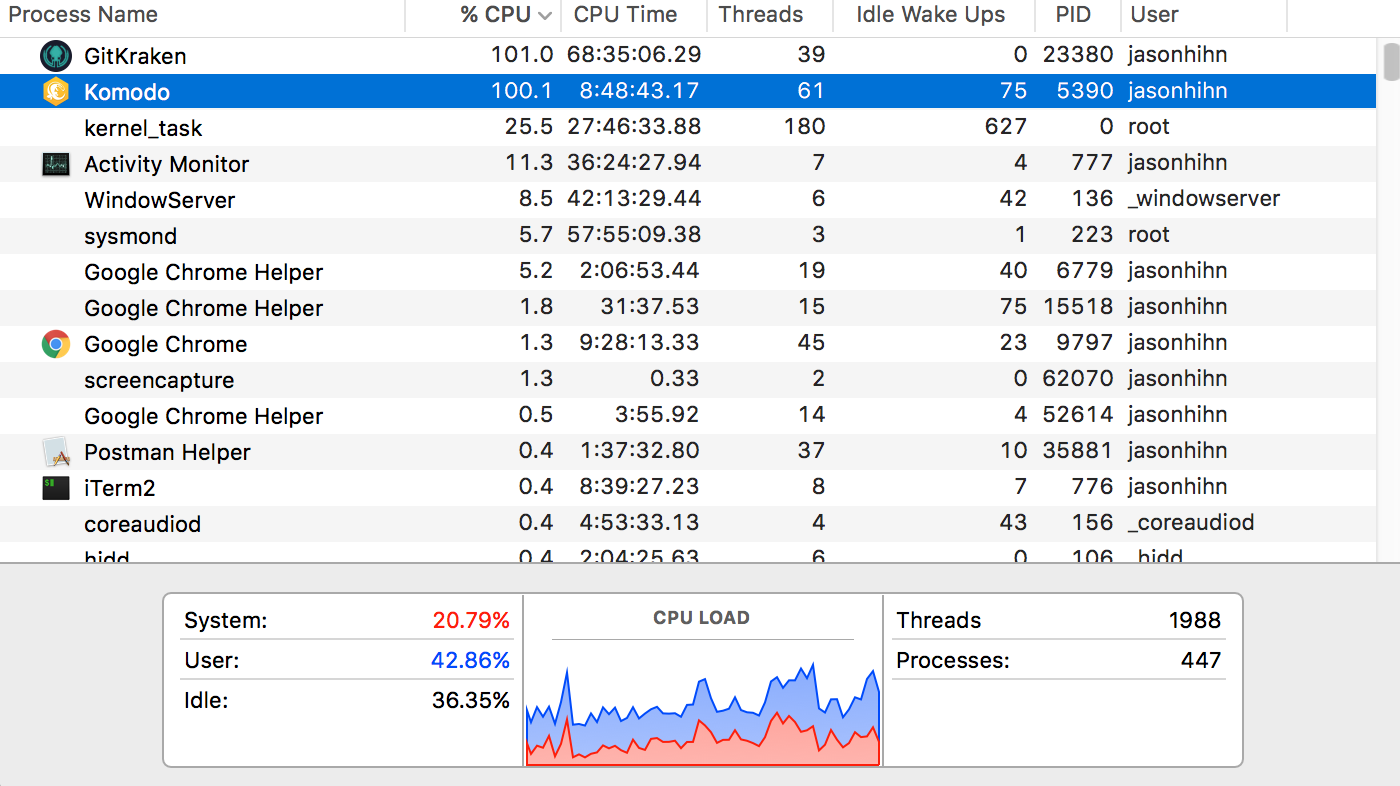
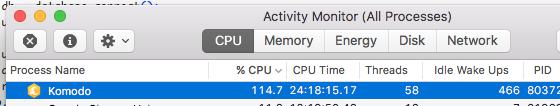
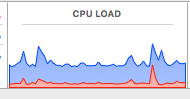
What I did notice is that when the K11 CPU usage was high the system usage was high as well:
Unfortunately that’s the only image I got, but I saw may times that when K11 was consuming a lot the pink was high as well. It never really went high without pink also going high.
I can’t help you unless you communicate this, what are the errors you’re getting?
If you contact sales@activestate.com they can extend your trial.
Thanks. I also updated the screenshots.
btw, do you use elastic tabstops? We’ve found them to often cause high CPU usage.
No, but they sound brilliant. I’m a tab advocate and spaces are wrong for what they are trying to convey, I always thought it was the implementation of tabs that was the problem, and that a proper implementation of tabs, not spaces, is what we need.