I want to just use the ‘Debugging JavaScript Locally’ for now.
With all files with both html and javascript in it, Chrome opens the file ‘file://C:/Users/adsiltia/Desktop/test.html’
Then after 2 seconds, I get the following error showing in the Komodo :
"INFO:chrome.dbgp.main:Debugging ‘file://C:\Users\adsiltia\Desktop\test.html’ over localhost:63089 on Chrome 127.0.0.1:9222 INFO:chrome.dbgp.DBGPClient:Connection to IDE established. ERROR:chrome.dbgp.DBGPClient:File URI or URL ‘file://C:/Users/adsiltia/Desktop/test.html’ unavailable for debugging. "
Hi there, for Chrome debugging to work Chrome needs to be started via the Komodo debugger. If Chrome is already running then it cannot operate in debug mode. This is a limitation in Chrome that we unfortunately cannot get around.
So please ensure that Chrome is closed completely before starting the debugging process. Note that once Chrome has started from the Komodo debugging process you can then keep it open, as it will be running with the correct debugging flags.
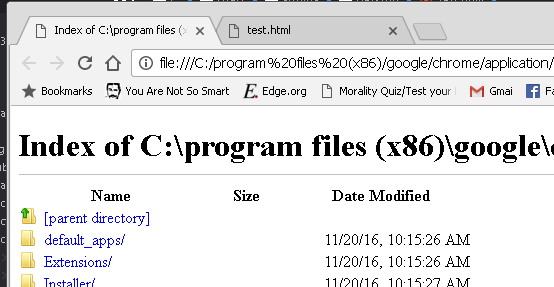
With Chrome initially closed (as recommended) , and a debug session started, I get two chrome tabs opening and one points to a file chrome path. I still get the same initial error however an no debugging.
Full path: file:///C:/program%20files%20(x86)/google/chrome/application/54.0.2840.99/
I am not sure what to try next. Maybe another PC, to see if it is a chrome setting issue?
Hi, you discovered a bug! The workaround is to prefix your filename in the debug dialog with “”. So you’ll debug “\C:\Users…” instead of “C:\Users…”. Chrome actually needs that extra slash for filenames to work on Windows.
It states, Configuring Google Chrome in the Preferences To specify which Google Chrome executable Komodo uses for debugging:
Select Edit|Preferences (OS X: Komodo|Preferences). In the Preferences dialog box under Languages, click JavaScript. Komodo searches for Google Chrome on your system and displays them in the drop-down list. If the preferred executable is in this list, click to select it. If not, click Browse to locate it. Click OK.
There was no browser search when looking under Edit|Preferences|Languages, only under “Web & Browser”.