I am trying to figure out if it is possible to add a formater for debug output in order to support ANSI escape codes.
I use different colours to highlight some output and it usually saves a lot of time to navigate trough.
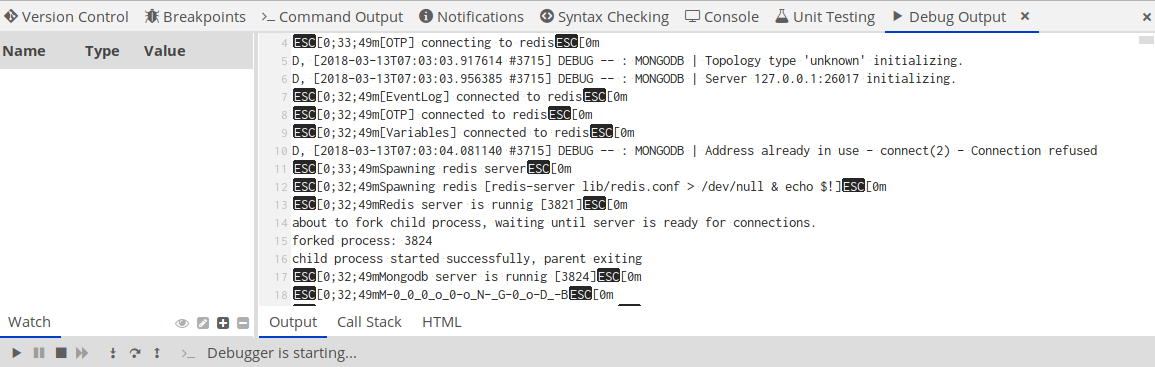
Currently debug output doesn’t know how to parse escape codes.
I have noticed that there is an HTML formatter which attempts to parse output as html markup. So I thought there might be a way to add something similar as an extension.
I played with Komodo’s Javascript Environment. and I figured how to get chrome window objects and do simple manipulations with them, but I couldn’t realise if there’s a way to listen on debug output from extension API. And I couldn’t find a lead where to find corresponding documentation.
There’s also related feature idea [ANSI escape code … debug output]