Debugger proxy, how?

I’ve read all the doc and tried all I can to make the debugger proxy work.

I know how to set xdebug to work with a specific “xdebug.remote_host”.

But I want to try instead with a debugger proxy, so with a “xdebug.remote_connect_back=1”.

How can I do that ?

The remote debugger is at “192.168.10.10”, and the local pc is at “192.168.1.106”

In komodo, if I enter “192.168.10.10:9000” as the debugger proxy, it doesn’t work.

Do I have to use the “pydbgpproxy” command on windows ?

If I do something like “pydbgpproxy -i 192.168.1.106:9001 -d 192.168.10.10:9000”, I get this :

“the debugger could not bind on port 9000”.

What am I missing ?

My xdebug settings

zend_extension=/usr/lib/php/20160303/xdebug.so
xdebug.remote_enable=1
xdebug.remote_handler=dbgp
xdebug.remote_mode=req
xdebug.remote_connect_back=1
xdebug.remote_port=9000
xdebug.idekey=komodo
xdebug.remote_autostart=1
~

I don’t know what your setup is so I can’t really give your specific instructions but I can give the generic steps:

  1. Start the proxy
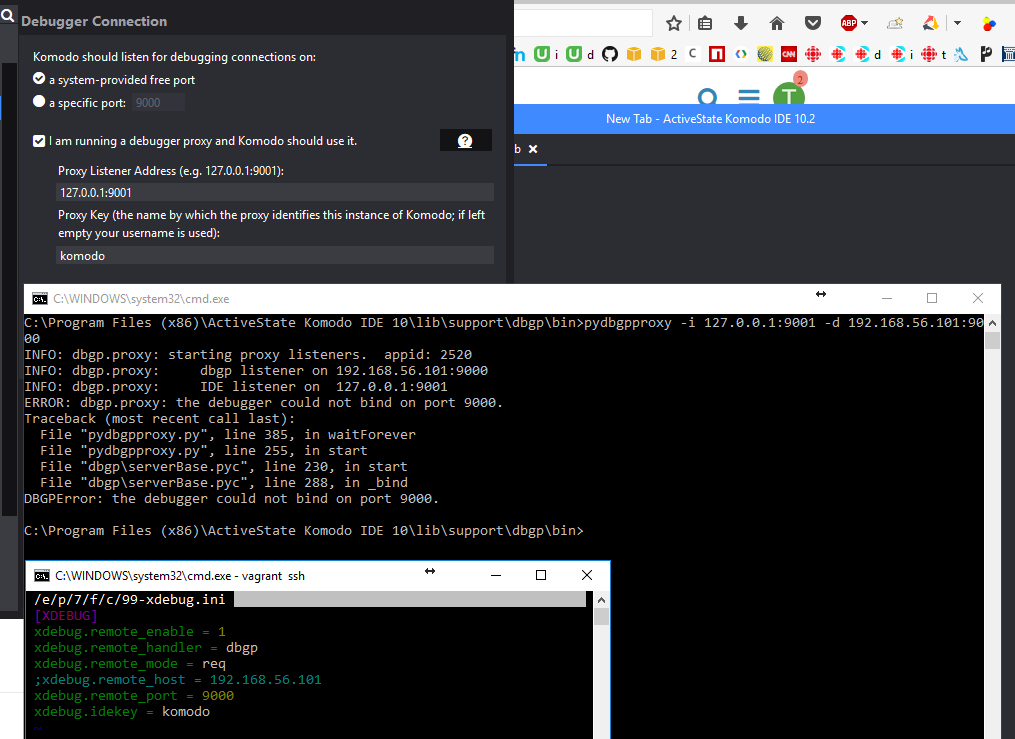
  2. Tell Komodo to connect to that proxy using Prefs > Debugger > Connection: I am running a debugger proxy… and Proxy Key. Looks like you used komodo
  3. Configure your xdebug env to connect to the Proxy

Helpful additional info would be:

  • a screenshot of your Komodo debugger config
  • the IP of each machine

You can run pydbgpproxy wherever you want as long as you use the right IPs and Port numbers and those are all routable and not blocked by either a firewall or another process using those ports. eg. if you tell pydbgpproxy to listen for connections on port 9000 AND you tell Komodo to listen on port 9000 one will block the other depending on which process starts first.

I don’t know what this is. It’s not from our docs? Why are you using it? Can you give me a reference why you’re using it?

  • Carey

I cannot recall where I found the “remote_connect_back=1”.
Anyway I removed it, and restarted apache/php

In windows (where komodo is), when I do this :
pydbgpproxy -i 127.0.0.1:9001 -d 192.168.56.101:9000

I get “ERROR: dbgp.proxy: the debugger could not bind on port 9000.”.

The remote machine is 192.168.56.101. xdebug is running on port 9000.

Local machine is 192.168.1.106

It works this way :

xdebug on remote vm : added back the " xdebug.remote_host = 192.168.1.106" setting.

komodo on windows : debugger proxy checked, set to 192.168.1.106:9001 , and komodo listens on system-provided free port.

windows :
pydbgpproxy -i 192.168.1.106:9001 -d 192.168.1.106:9000

So the question :

Is it possible to use this instead :
pydbgpproxy -i 127.0.0.1:9001 -d 192.168.56.101:9000

And not having to specify a xdebug.remote_host on the remote machine where xdebug runs ?

Please share a screenshot of your prefs.

At the bottom, is the xdebug settings on 192.168.56.101.
“remote_host” is commented since I’m using the debugger proxy " -d 192.168.56.101 "

So, is it possible with pydbgpproxy -i 127.0.0.1:9001 -d 192.168.56.101:9000 ?

pydbgpproxy is running on windows
And 192.168.56.101.9000 is the remote xdebug (without a remote_host parameter).

First thing I notice is that your remote server is configured to connect to 192.168.56.101:9000 but so is your -d option in the pydbgpproxy command. They are different machines so that configuration doesn’t make sense.

The PHP config should have the IP of the Windows machine. (my guess is this one is wrong).
The -d option for pydbgpproxy should be the IP of the PHP server.

  • Carey

No, the remote_host parameter is commented.

I don’t need this parameter since the " -d " option is the remote machine where xdebug and php runs.

So " -i " is the local komodo (127.0.0.1:9001), and " -d " is the remote 192.168.56.101:9000.

“The -d option for pydbgpproxy should be the IP of the PHP server.” : that’s 192.168.56.101

But the command :
pydbgpproxy -i 127.0.0.1:9001 -d 192.168.56.101:9000

Gives me "“the debugger could not bind on port 9000”.

I’m fairly certain that’s not true. Try uncommenting that line and put the correct IP and restart your PHP server then start pydbgpproxy.

  • Carey

Yes, it works with the “xdebug.remote_host=192.168.1.106” (on 192.168.56.106), and using pydbgpproxy -i 127.0.0.1:9001 -d 192.168.1.106:9000 (on 192.168.1.106).

In the doc, it doesn’t say we have to use the remote_host param :
http://docs.activestate.com/komodo/4.4/debugger.html#dbgp_proxy

But it seems quite obvious now :wink: Thanks!

The pydbgpproxy docs are only for itself. It assumes your debug process is properly configured which yours wasn’t. You wouldn’t have been able to debug with or without the proxy :slight_smile:
Glad we got you sorted!

  • Carey

I’m sorry to say it’s not working at all.

It was only working because of mapped urls.

What are the correct parameters ?

.\pydbgpproxy.exe -i 127.0.0.1:9000 -d 192.168.1.106:9001

And in komodo : listen on 9000, with debugger proxy set to 192.168.1.106:9001 ?

When clicking “apply”, komodo hangs.

My xdebug set up on vm :

zend_extension=/usr/lib/php/20160303/xdebug.so
xdebug.remote_enable = 1
xdebug.remote_handler=dbgp
xdebug.remote_mode=req
xdebug.remote_host=192.168.1.106
xdebug.remote_port=9001
xdebug.idekey=komodo
xdebug.remote_autostart=1

You are reading the documentation for Komodo IDE version 4.4, which is almost a decade old. Please always use the latest documentation:

Thanks.

Here’s what I get with this command :

.\pydbgpproxy.exe -i 127.0.0.1:9001 -d 127.0.0.1:9000

INFO: dbgp.proxy: starting proxy listeners. appid: 12576
INFO: dbgp.proxy: dbgp listener on 127.0.0.1:9000
INFO: dbgp.proxy: IDE listener on 127.0.0.1:9001
INFO: dbgp.proxy: Server:onConnect (‘127.0.0.1’, 52350) [proxystop -k komodo]
INFO: dbgp.proxy: connection from 127.0.0.1:52351 [<main.sessionProxy instance at 0x02737648>]
INFO: dbgp.proxy: ‘Closing connection, invalid protocol used’ <main.sessionProxy instance at 0x02737648>
No handlers could be found for logger “dbgp.server”
INFO: dbgp.proxy: session stopped

In komodo :
listen specific 9001

using debugger proxy 127.0.0.1:9000

Same using -d 192.168.1.106:9000 , and debugger proxy 192.168.1.106:9000

And with this :

set PYTHONPATH=“C:\Program Files (x86)\ActiveState Komodo IDE 10\lib\support\dbgp\pythonlib;%PYTHONPATH%”
cd C:\Program Files (x86)\ActiveState Komodo IDE 10\lib\support\dbgp\bin
pydbgpproxy

I get this :

INFO: dbgp.proxy: starting proxy listeners. appid: 6904
INFO: dbgp.proxy: dbgp listener on 127.0.0.1:9000
INFO: dbgp.proxy: IDE listener on 127.0.0.1:9001

Then in Komodo :
a specific port : 9001 (because “IDE listener on 9001”)

debugger proxy :
127.0.0.1:9000
komodo

Listen for debug, then :

INFO: dbgp.proxy: connection from 127.0.0.1:52983 [<main.sessionProxy instance at 0x025EAF58>]
INFO: dbgp.proxy: ‘Closing connection, invalid protocol used’ <main.sessionProxy instance at 0x025EAF58>
No handlers could be found for logger “dbgp.server”
INFO: dbgp.proxy: session stopped
INFO: dbgp.proxy: connection from 127.0.0.1:52984 [<main.sessionProxy instance at 0x025F1058>]
INFO: dbgp.proxy: ‘Closing connection, invalid protocol used’ <main.sessionProxy instance at 0x025F1058>
INFO: dbgp.proxy: session stopped
INFO: dbgp.proxy: connection from 127.0.0.1:52985 [<main.sessionProxy instance at 0x025F10D0>]
INFO: dbgp.proxy: ‘Closing connection, invalid protocol used’ <main.sessionProxy instance at 0x025F10D0>
INFO: dbgp.proxy: session stopped

It would be extremely useful to have a video that shows how to make this work, with a windows host and a linux VM.

Maybe this is an important detail :

I’m using a VM shared folder :
D:\htdocs\blabla\sites\taskbeg
Is synced to
/home/blabla/taskbeg

Whatever I create locally in D:\htdocs\blabla\sites\taskbeg, will be created in /home/blabla/taskbeg , and vice versa.

Is it the reason why remote debugging is not working ?

Does remote debugging intended for when I work directly with the remote file on the host (i.e. not with a synced folder) ?

I’m confused as to why you are using a proxy at all, you’re connecting to a VM which runs on your local machine. Why do you need a proxy?

Reading the log it sounds like the proxy might be mangling requests somehow.

If I don’t need a proxy, how do I debug in komodo ?

As I said, local folder is synced to VM folder.

So, does “mapped urls” is the only way to debug in this case ? (btw, “mapped urls” debugging only works with port 9000 for me)

In which scenario a proxy would be used ? Is it with komodo using directly the remote file ?

Can you please clarify this :
“Proxy Listener Address: The interface IP address and port Komodo uses to listen for connections from the proxy. By default, the debugger proxy uses port 9000 to listen for remote debuggers and port 9001 to listen for connections from Komodo.” :

  • does 9000 corresponds to this : “Komodo should listen for debugging connection on a specific port: 9000”.
  • and 9001 to this : “I am running a debugger proxy and Komodo should use it : Proxy listener address : 127.0.0.1:9001” ?

Just configure for remote debugging:

http://docs.activestate.com/komodo/11/manual/debugphp.html#remote-php-debugging

Proxy debugging is another layer which from what I’m reading you have no need for.